Decreasing busy social workers need for building custom reports
Paloma Systems · May 2024
Paloma Systems create software for local authorities to manage their social workers.
By interviewing current customers and ex-customers, a major pain point for a manager of a team is to get a report showing the state of their services and teams. It's vital to be able to get data and insights for their relevant services and clients so that funding and resourcing decisions can be made.
The previous reporting system was a confusing experience, and things were quickly added as feature requests per client, not often thinking about how they would be used across multiple organisations, often leading to a lot of custom reports, meaningless to the other organisations.
Managers were often exporting all of the data in the platform, and then filtering it to build a report externally. More often than not the reports are ran monthly, quarterly and yearly cycles with slight tweaks each time.
I designed a new reporting system which allows users to select predefined, and saved reports, then modify filters and show/hide columns to then export to a CSV or PDF. Working closely managers, decision makers and team leads ensured the reporting function was robust and met their needs. When the first iteration was ready, we ran a closed beta with a small group of managers and then iterated on real feedback after actual use.
Timeframe: 3 months
My roles:
Product DesignFront-End Development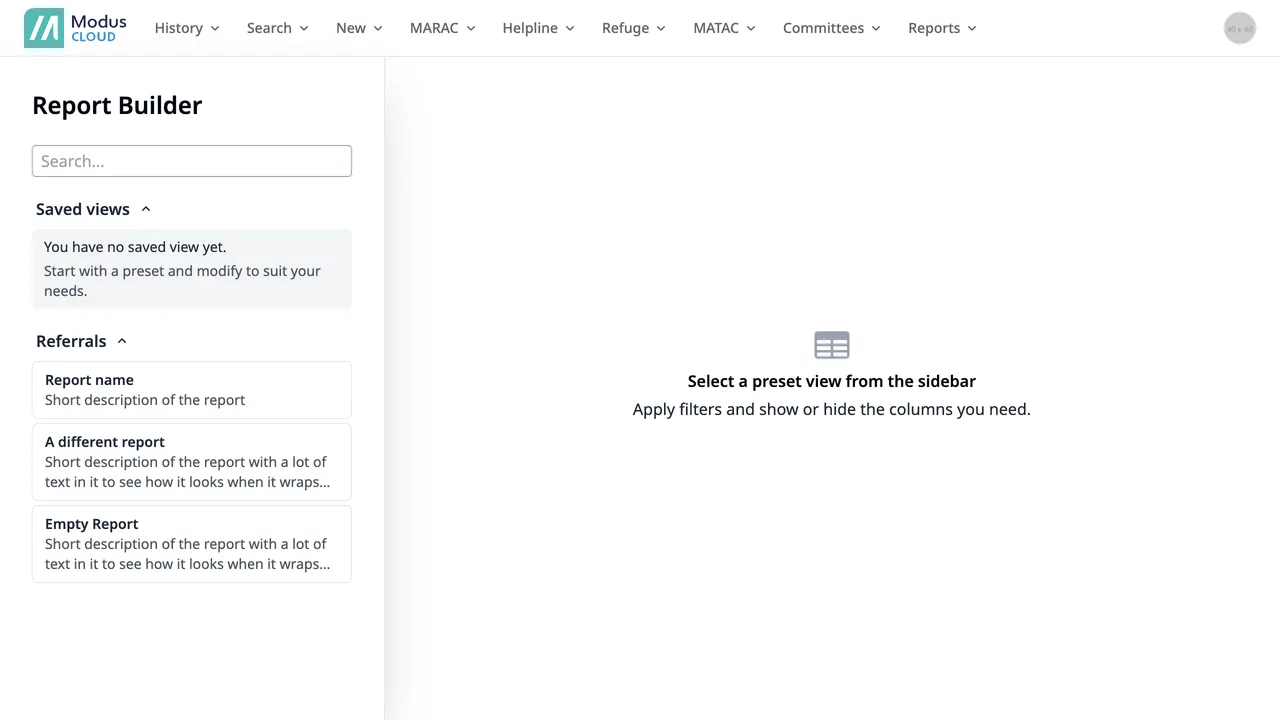
First time view
Users would be presented with a list of reports to select from, once they’ve used the reporting, they’ll typically pick from their saved reports. But if they haven’t created any, they’ll be presented with some predefined reports, which were based upon commonly exported reports previously as well as some new ones we discussed with users themselves.
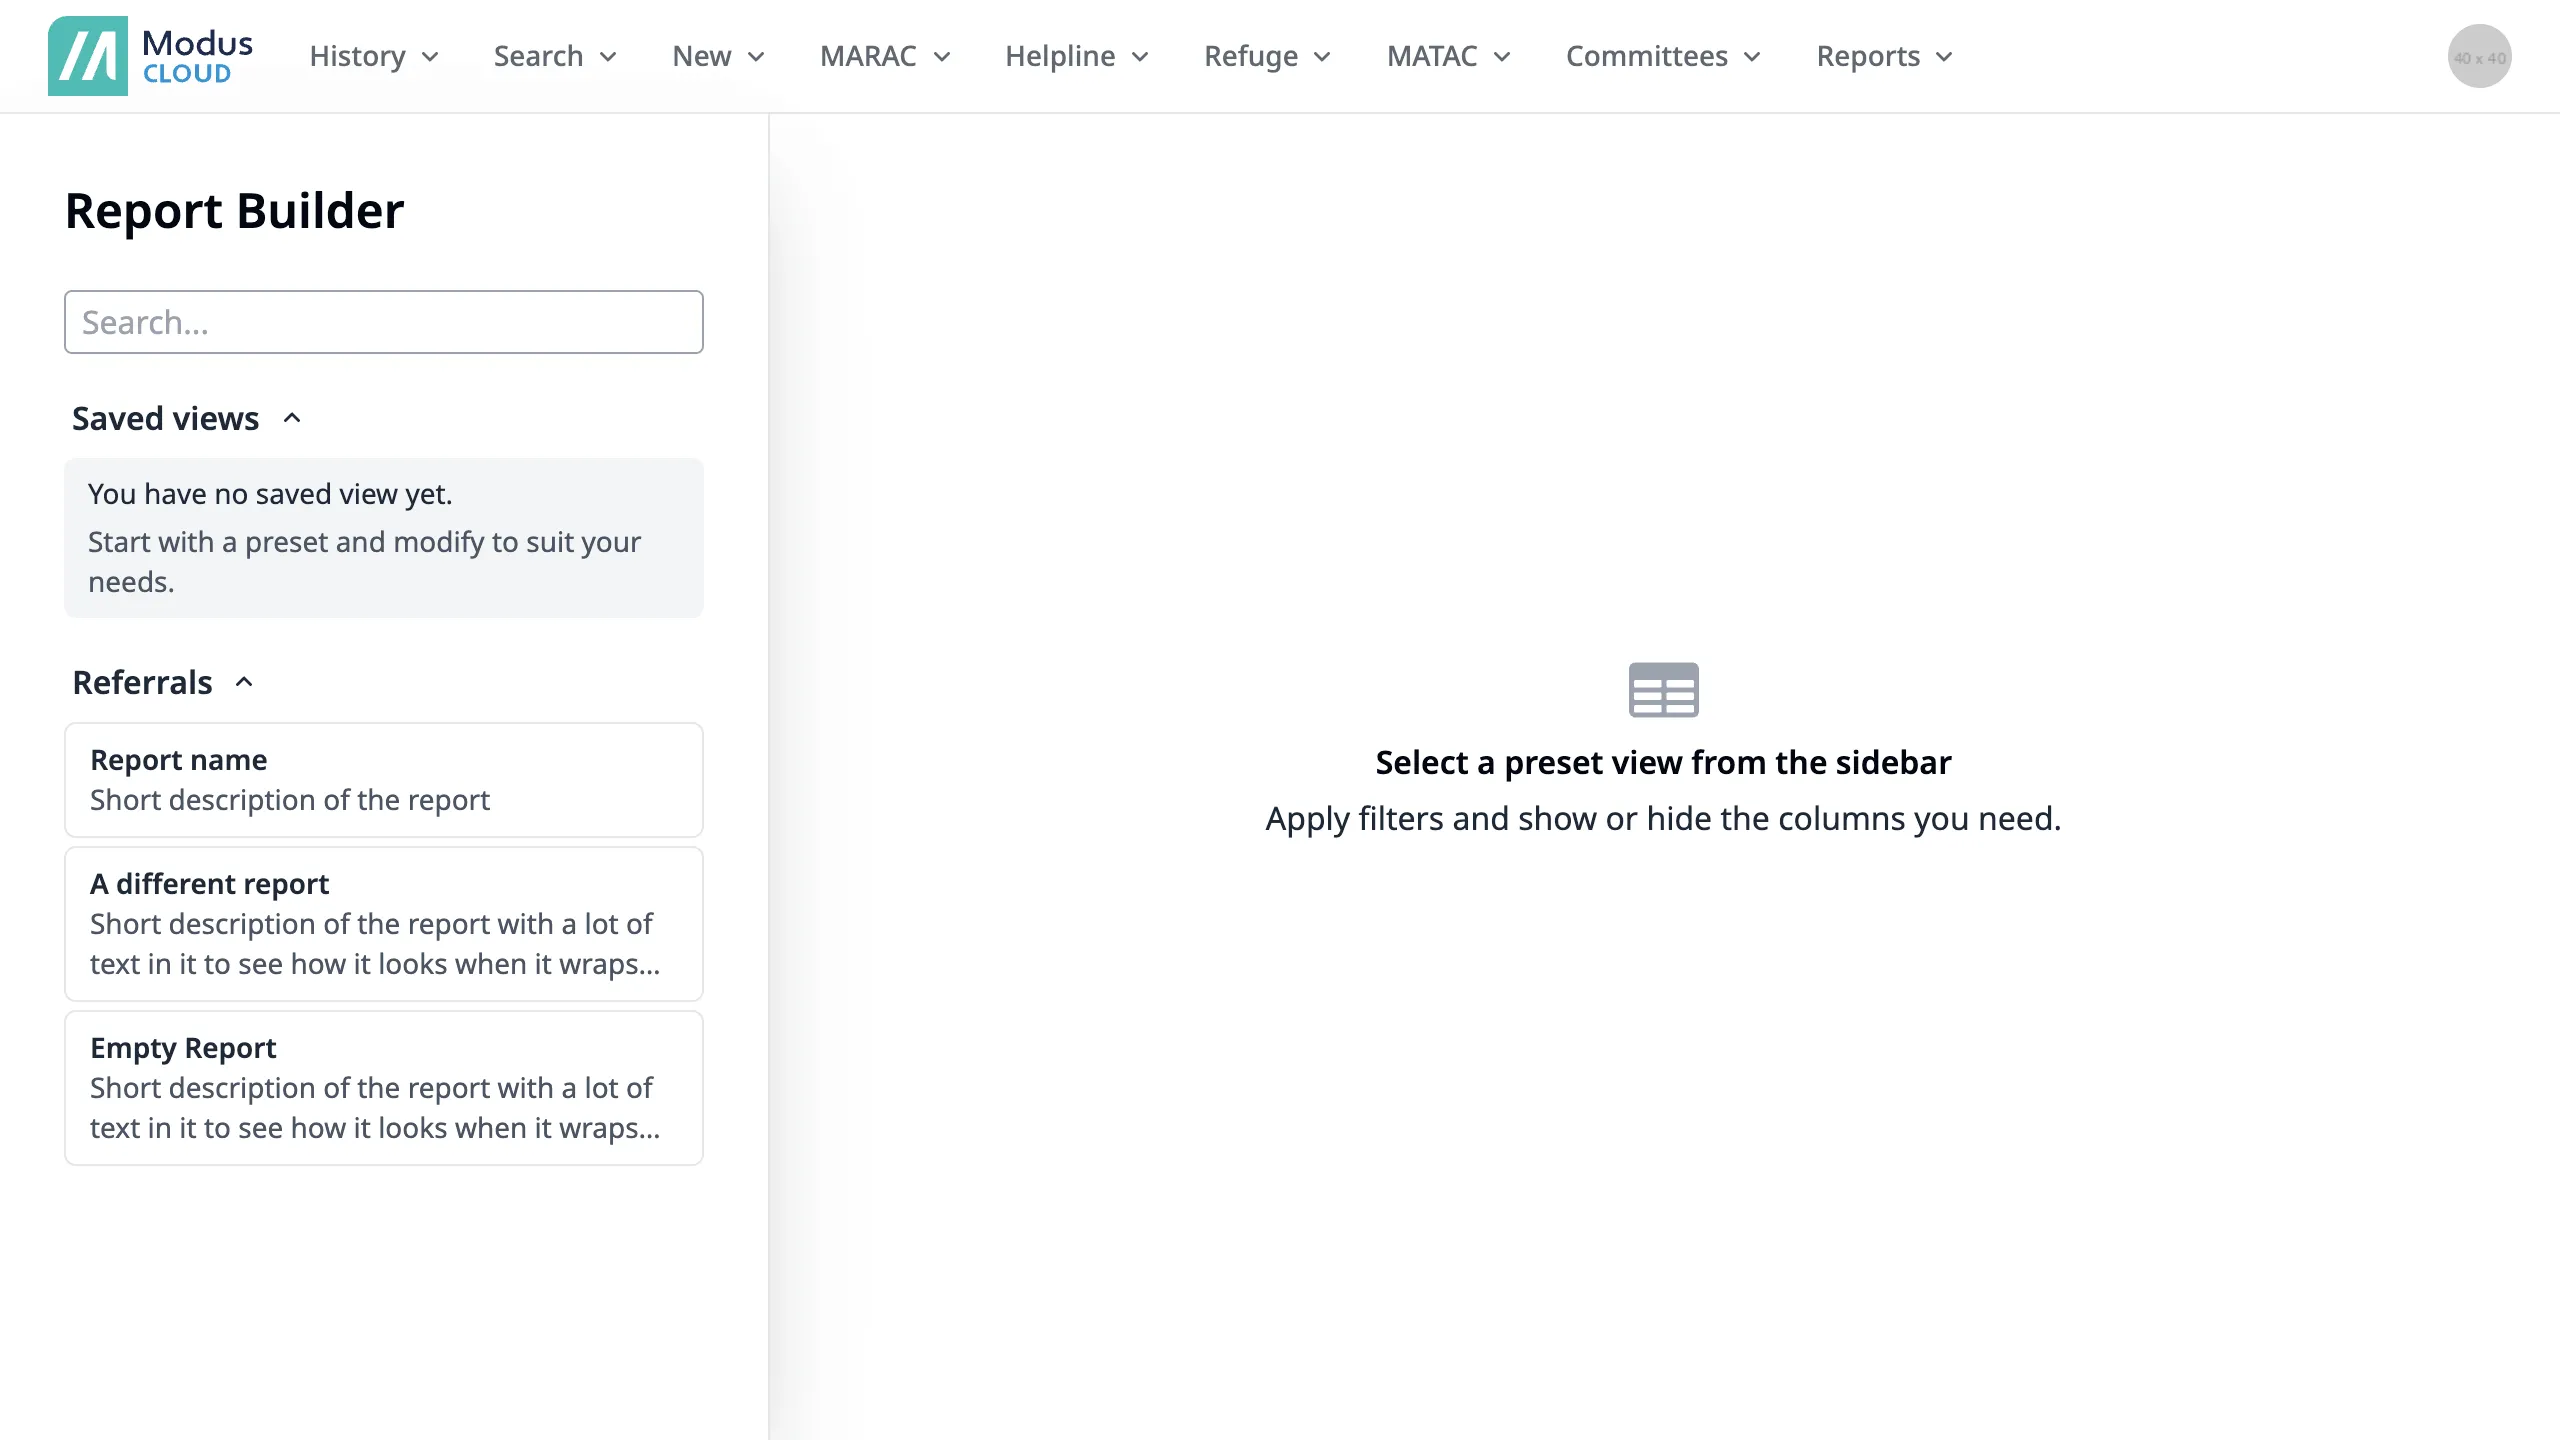
Viewing a report
Once a report is selected, the user is presented with a list of the data, with the ability to filter and search.
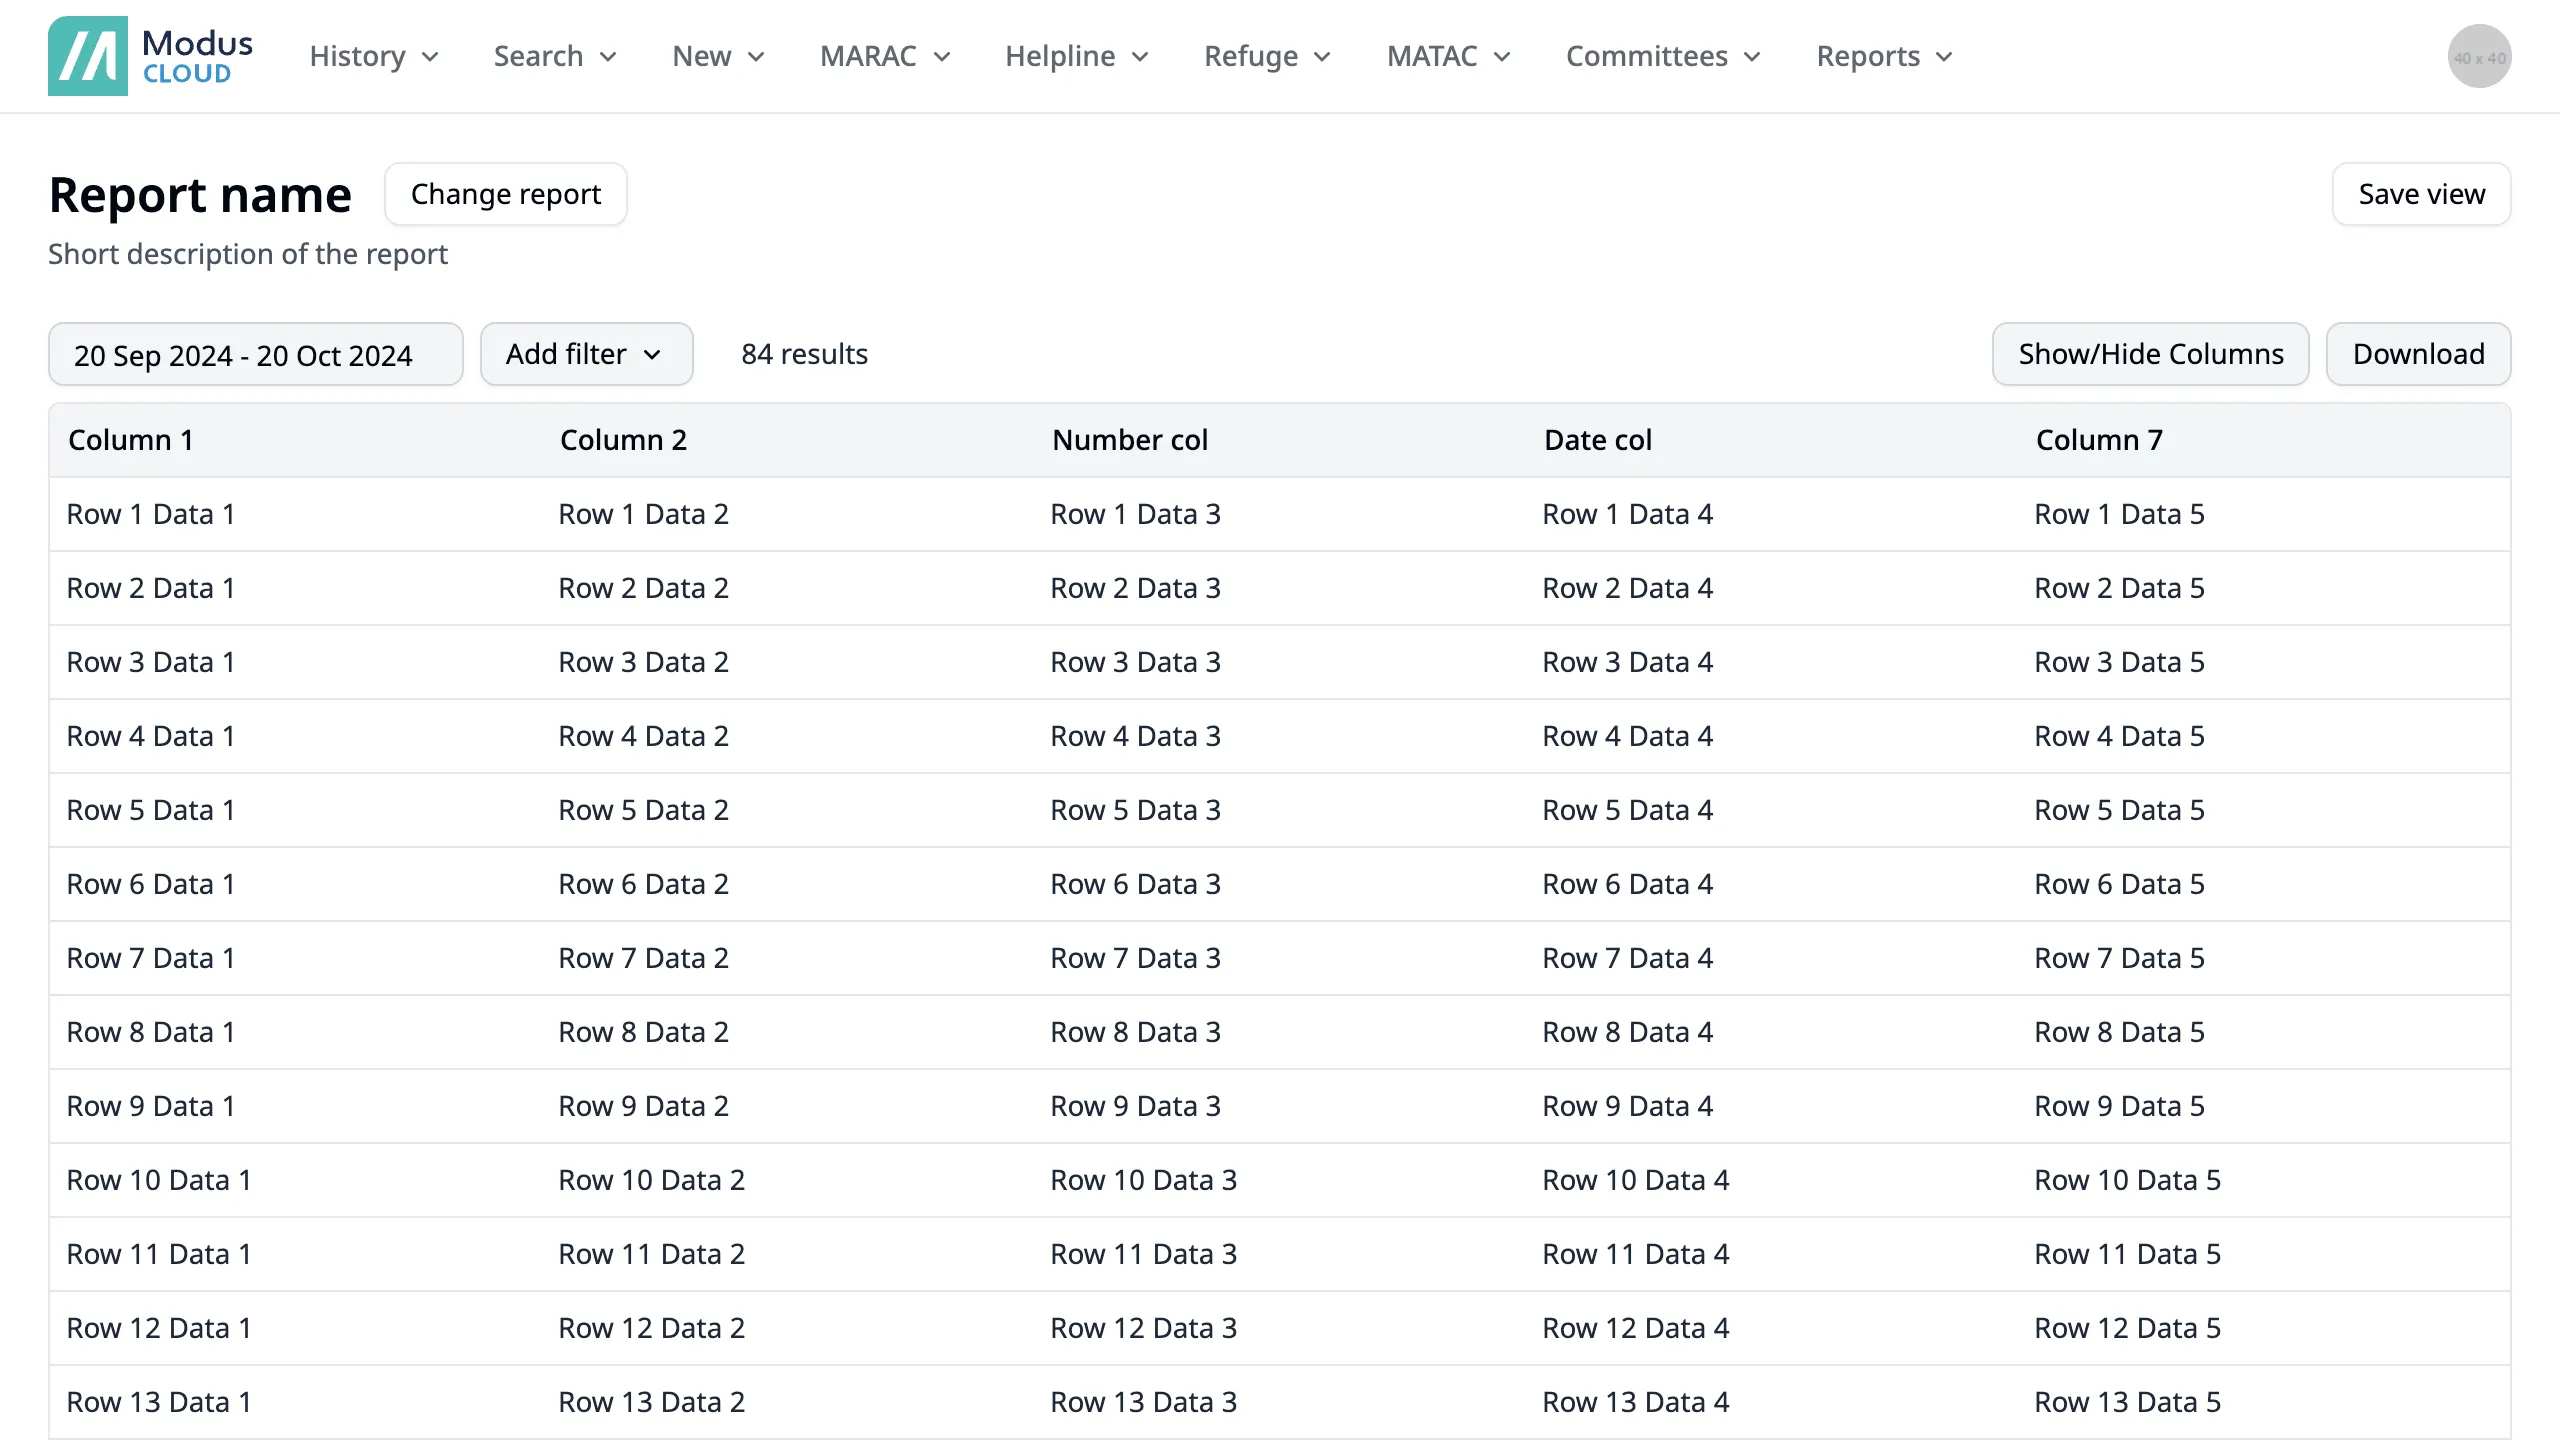
If the report was saved, then it’d be shown with applied filters, sorting and columns shown/hidden. This was vital since users were setting up the same filters each time on a recurring report.
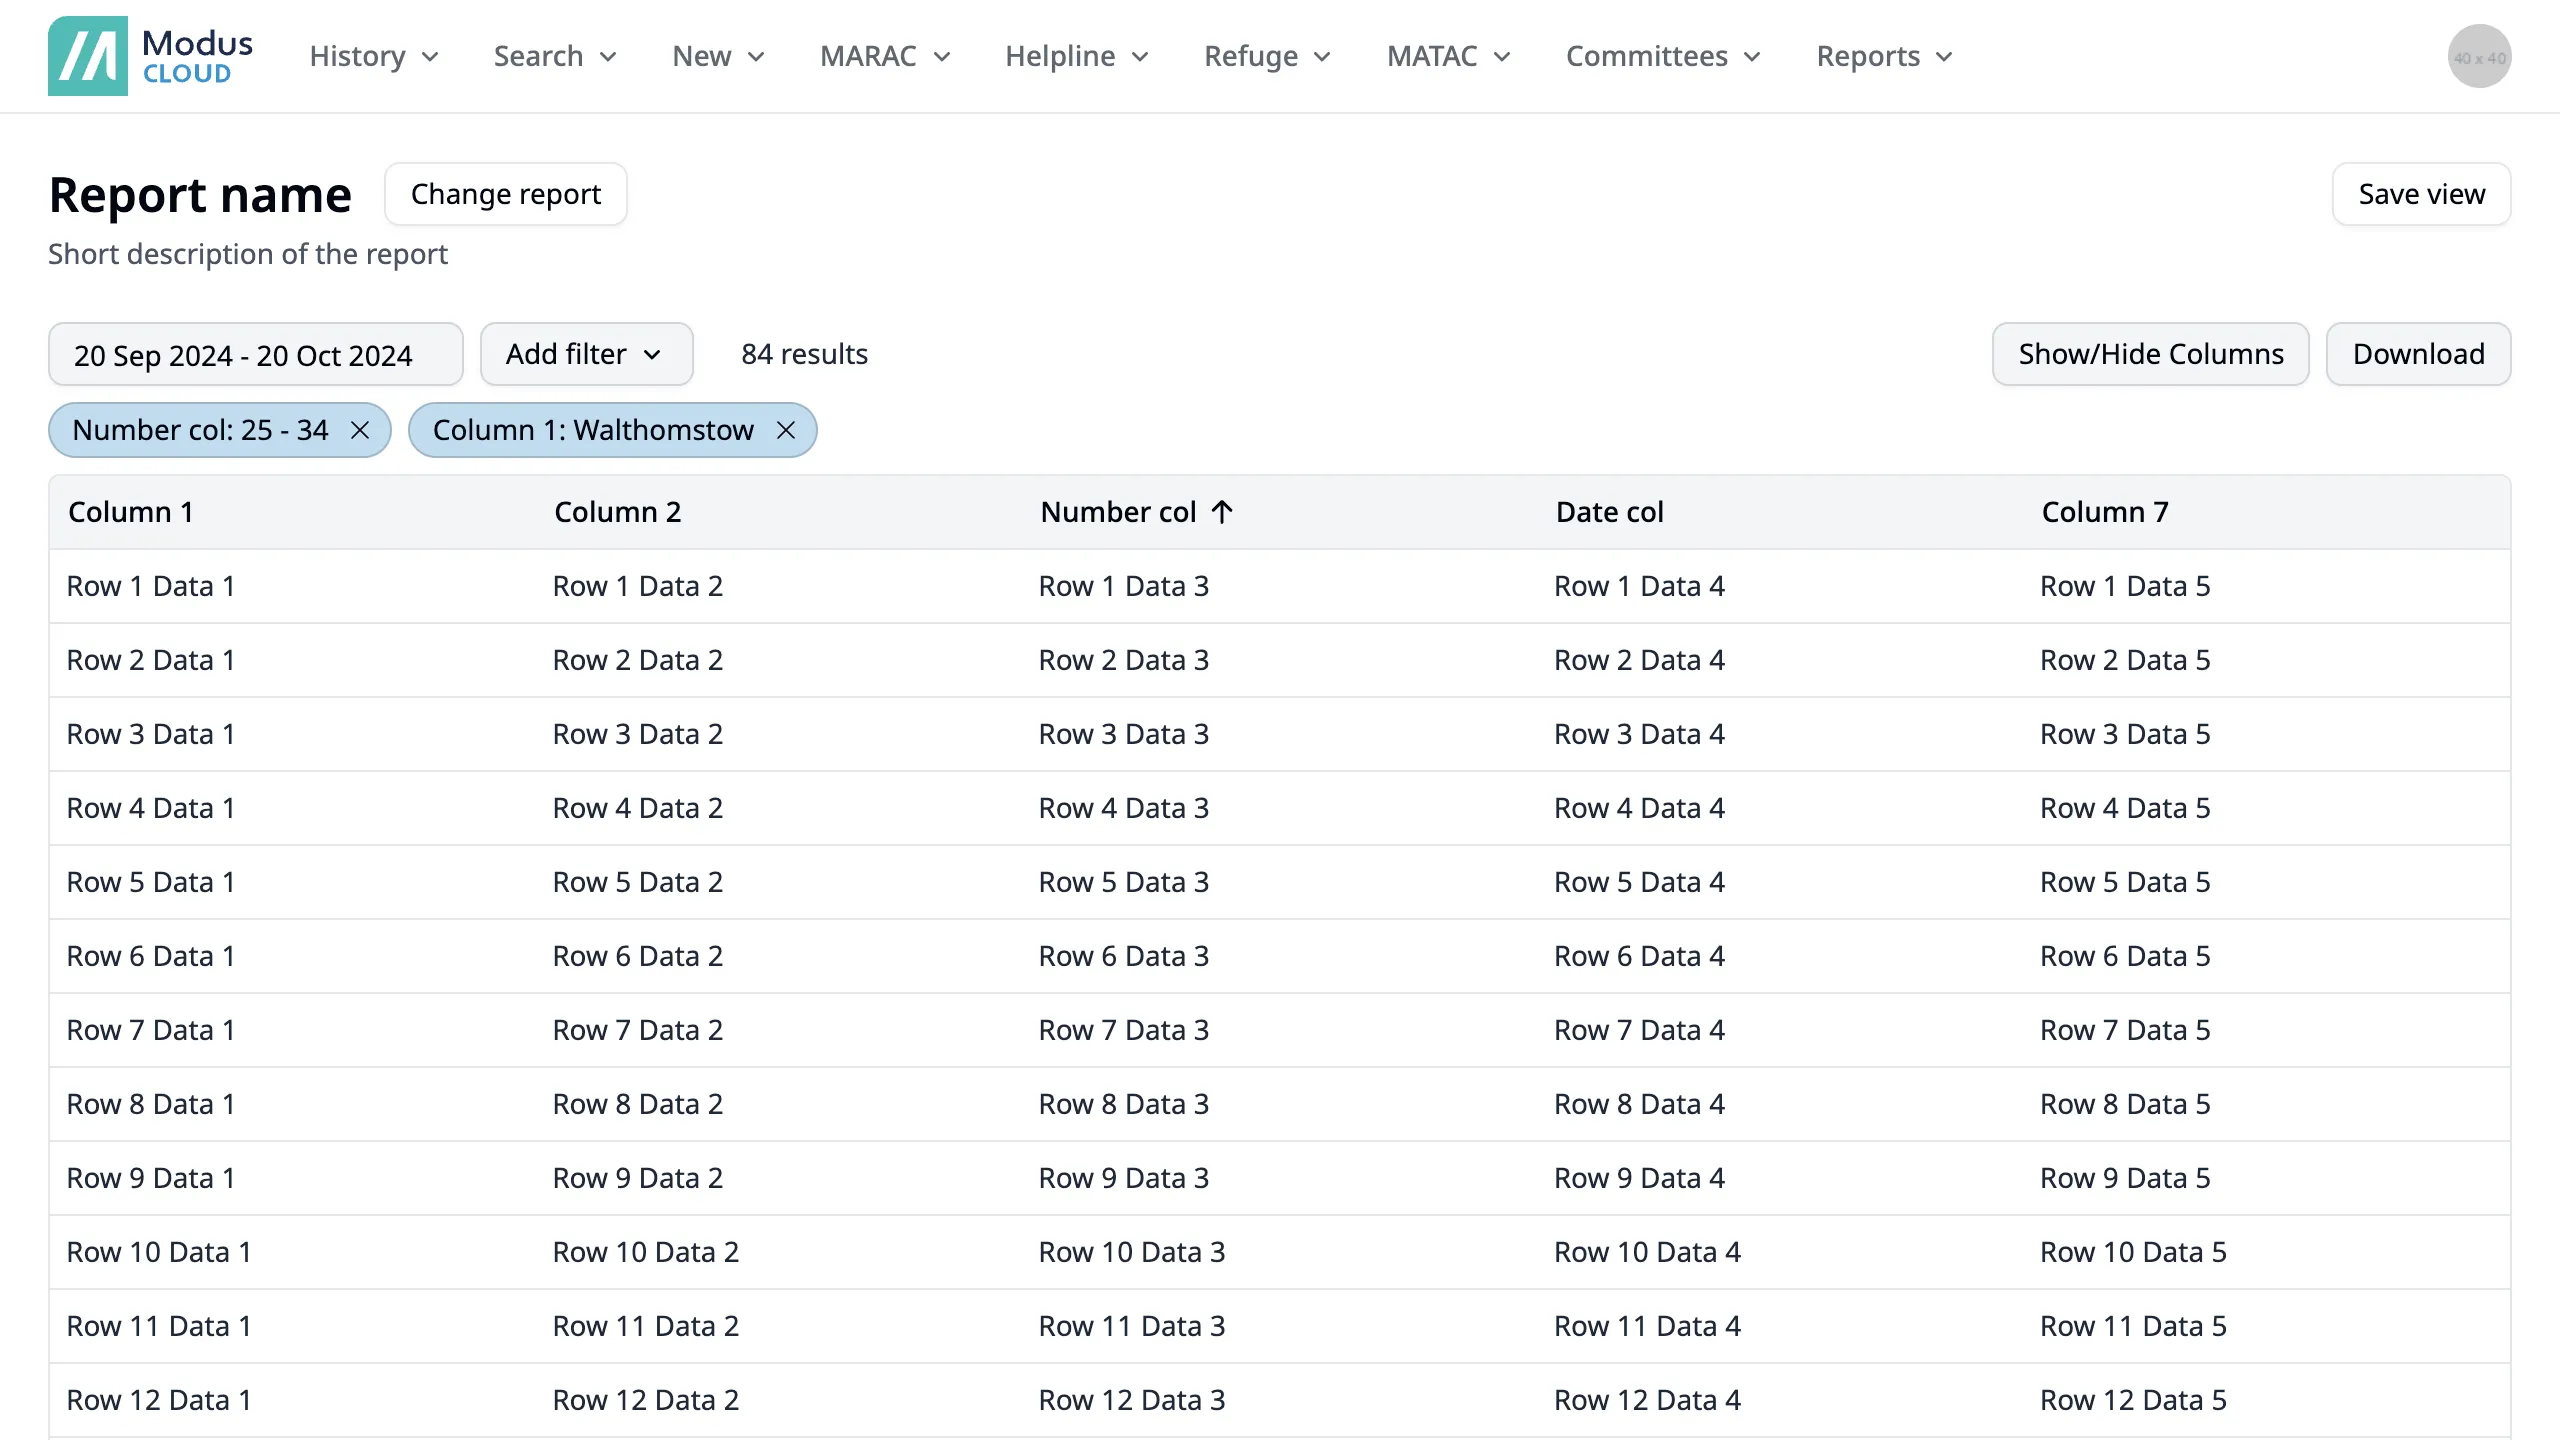
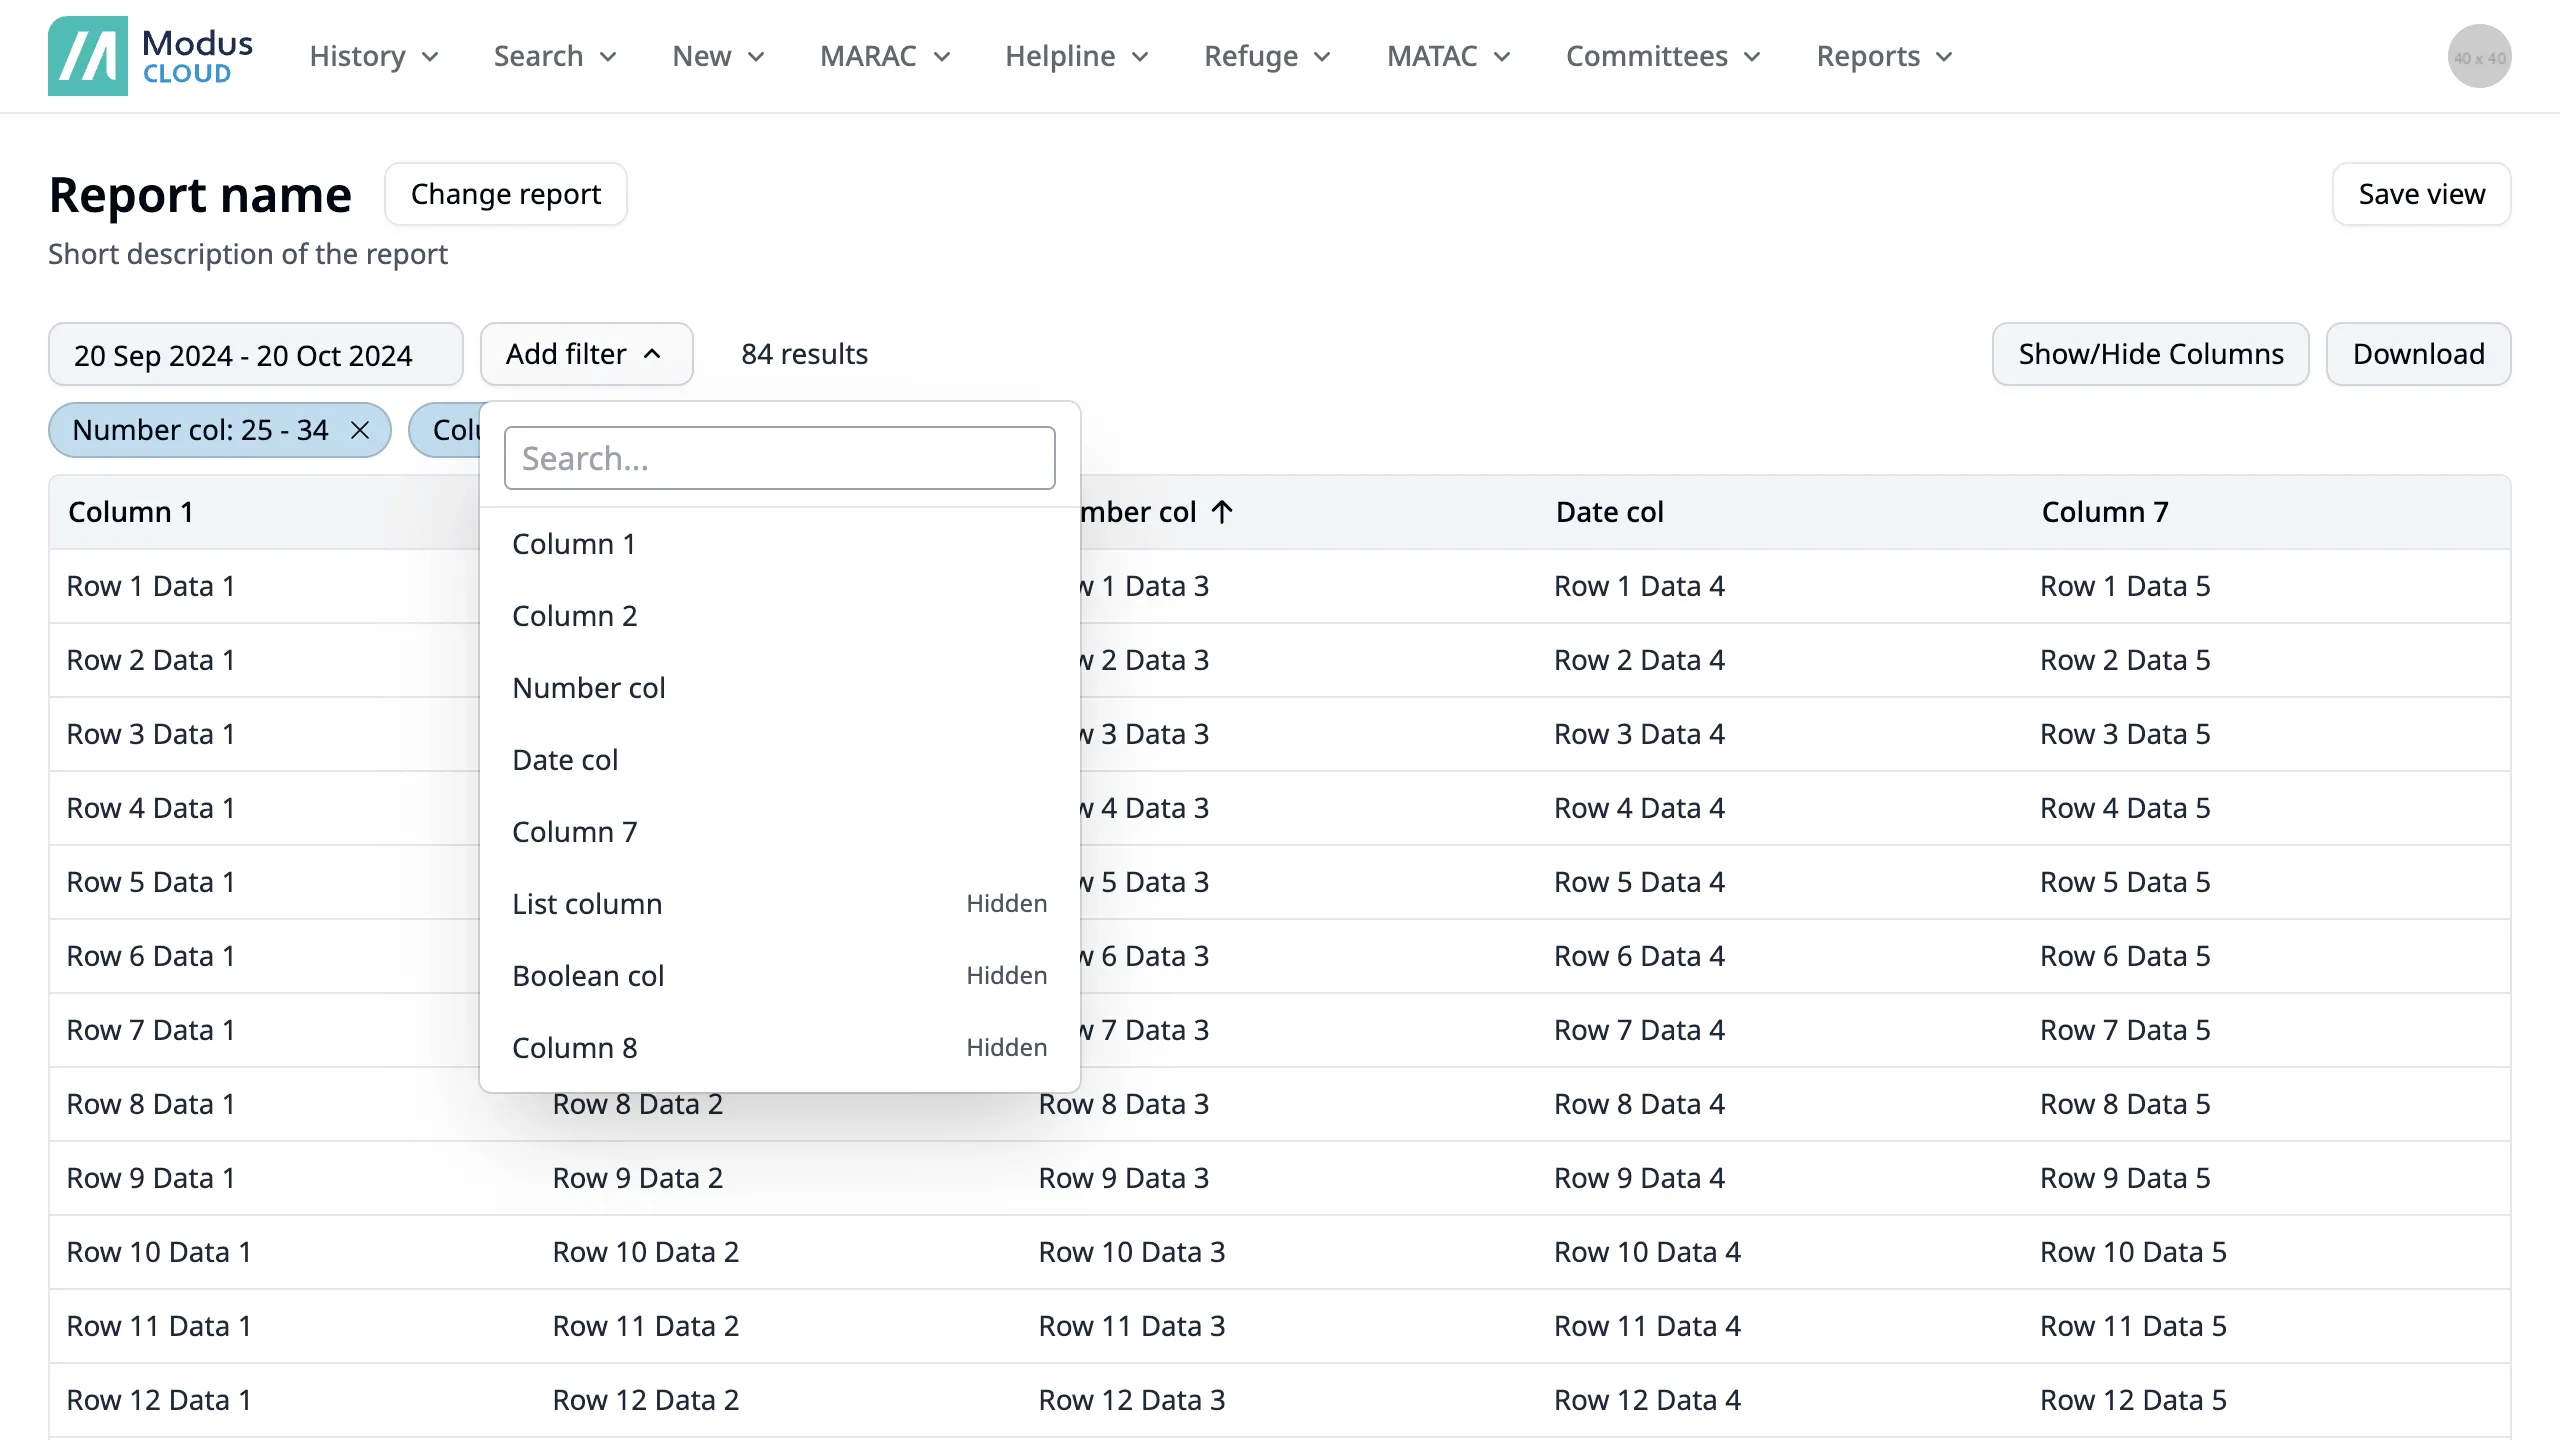
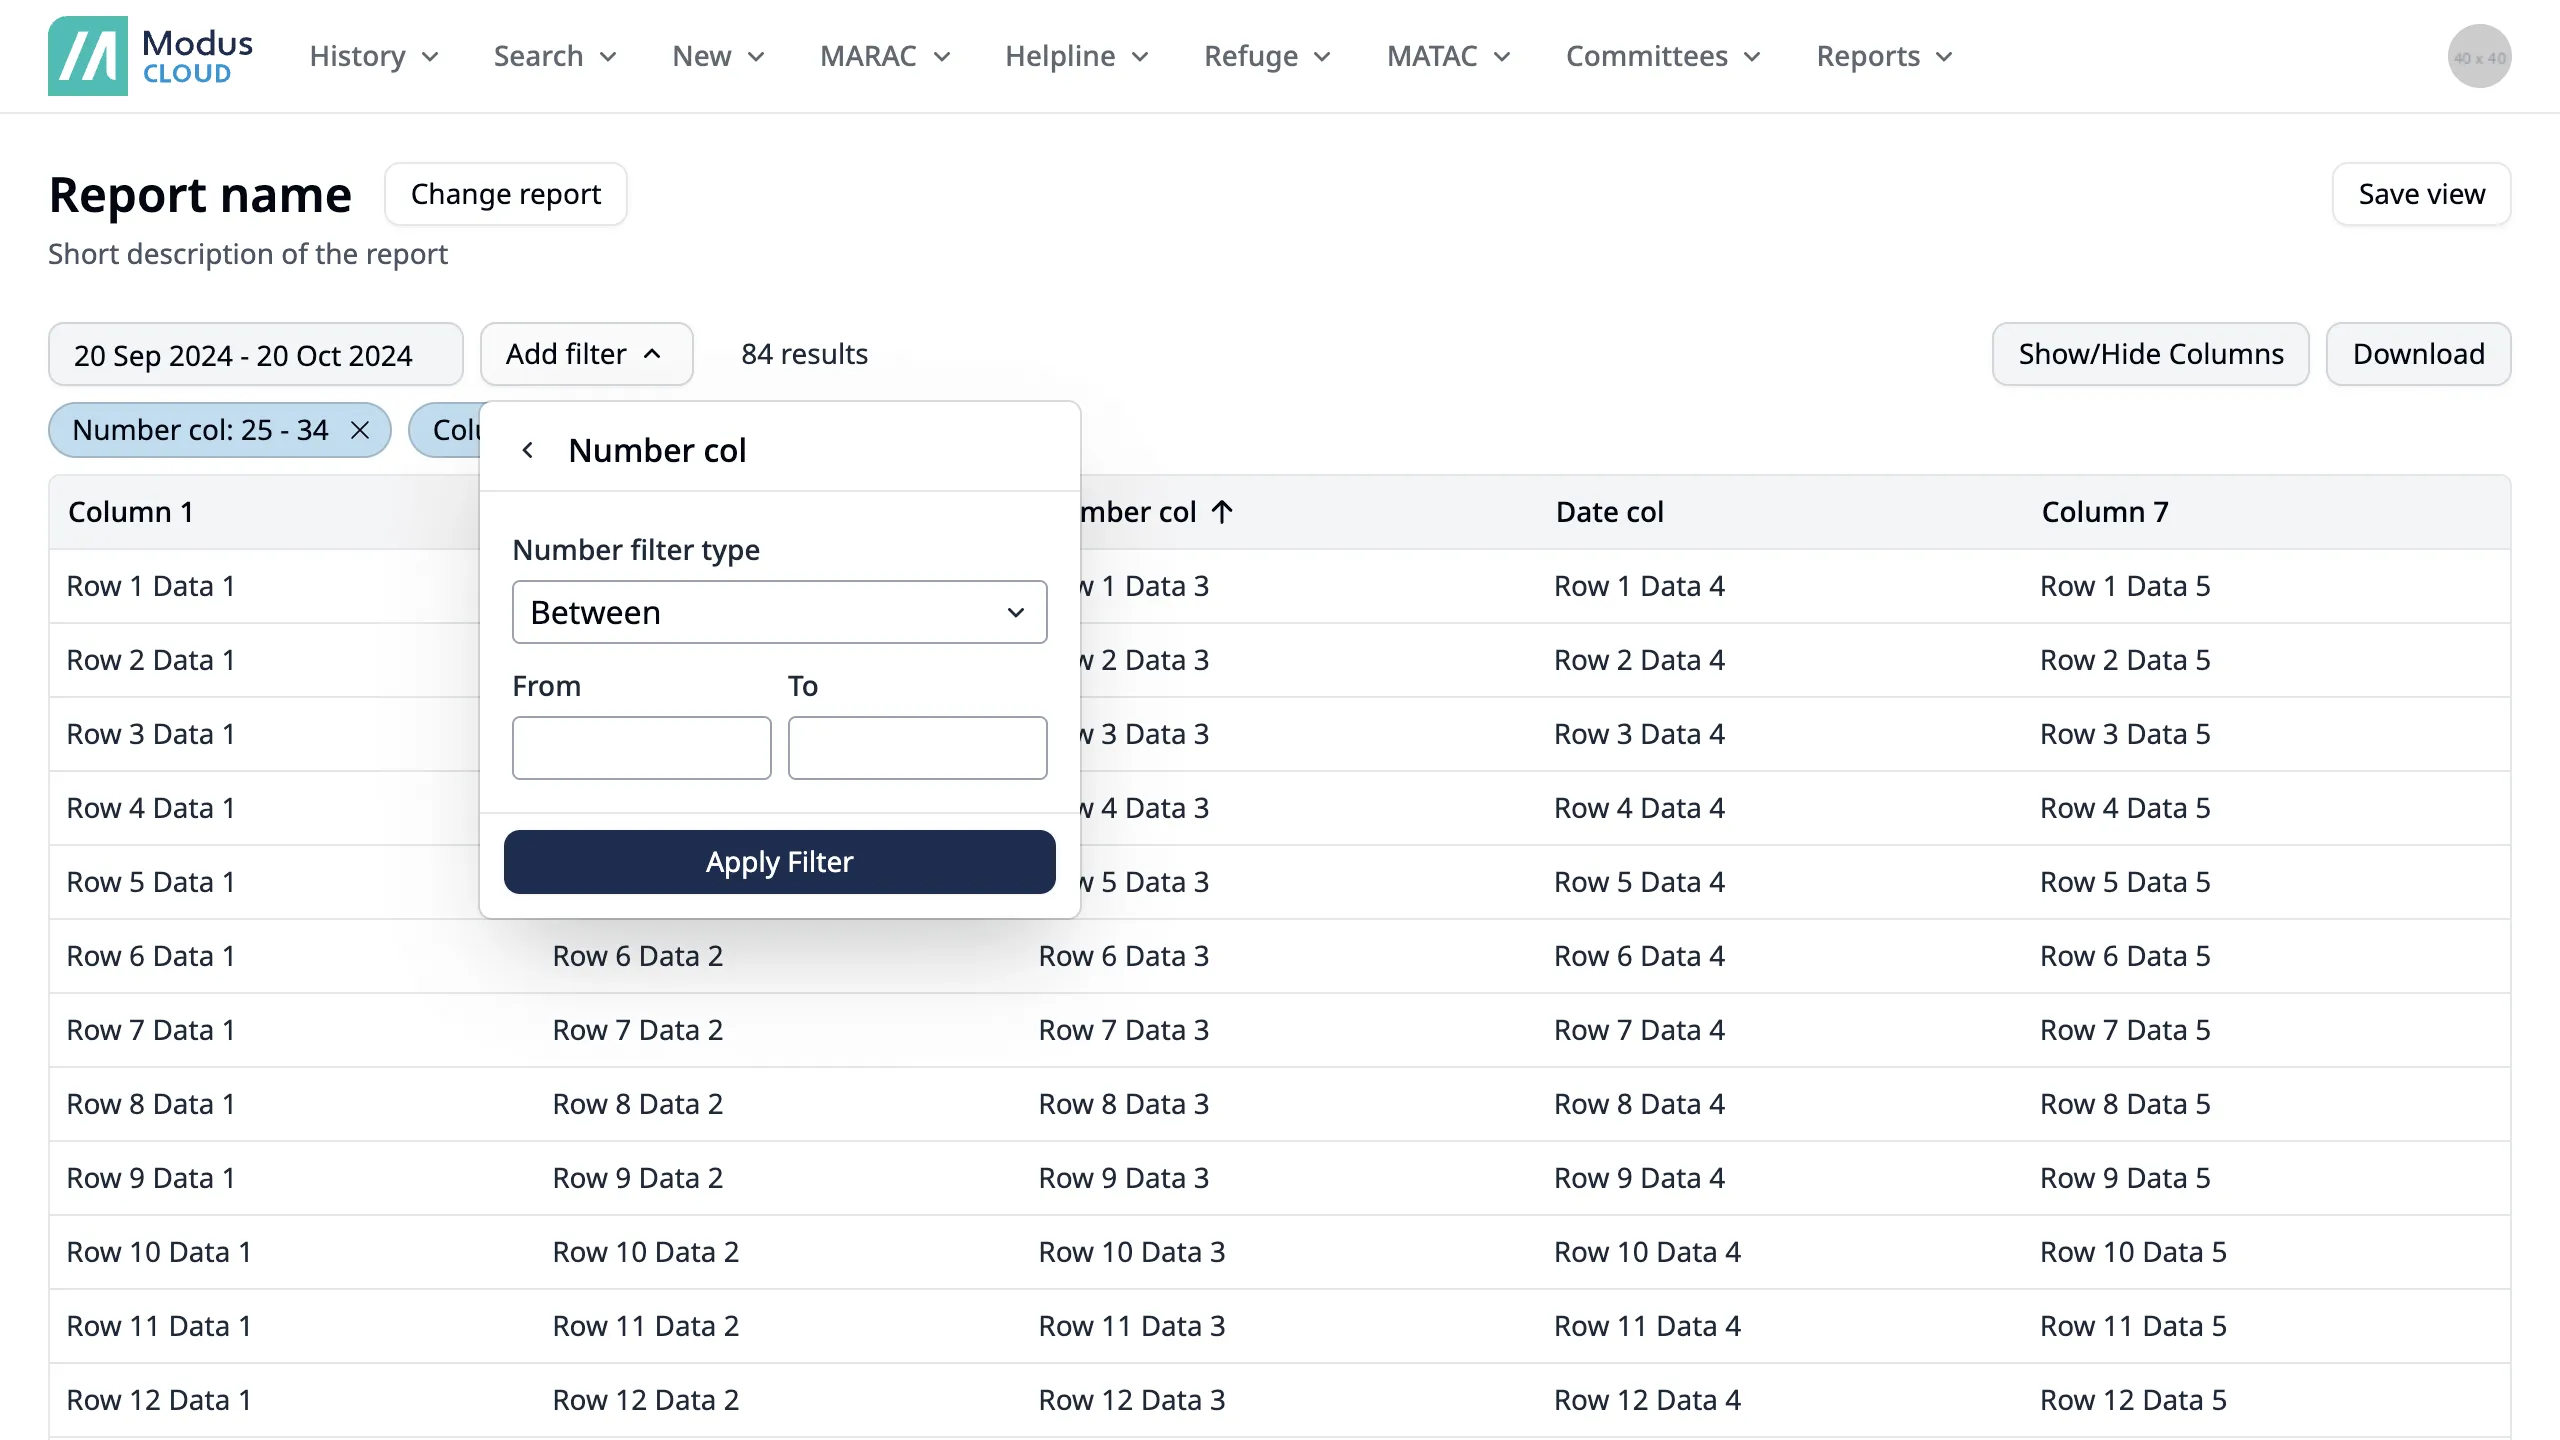
Filtering and sorting
Users could filter and sort the data to their needs, multiple approaches of filtering were tested but being able to see all the applied filters was seen as most favourable.
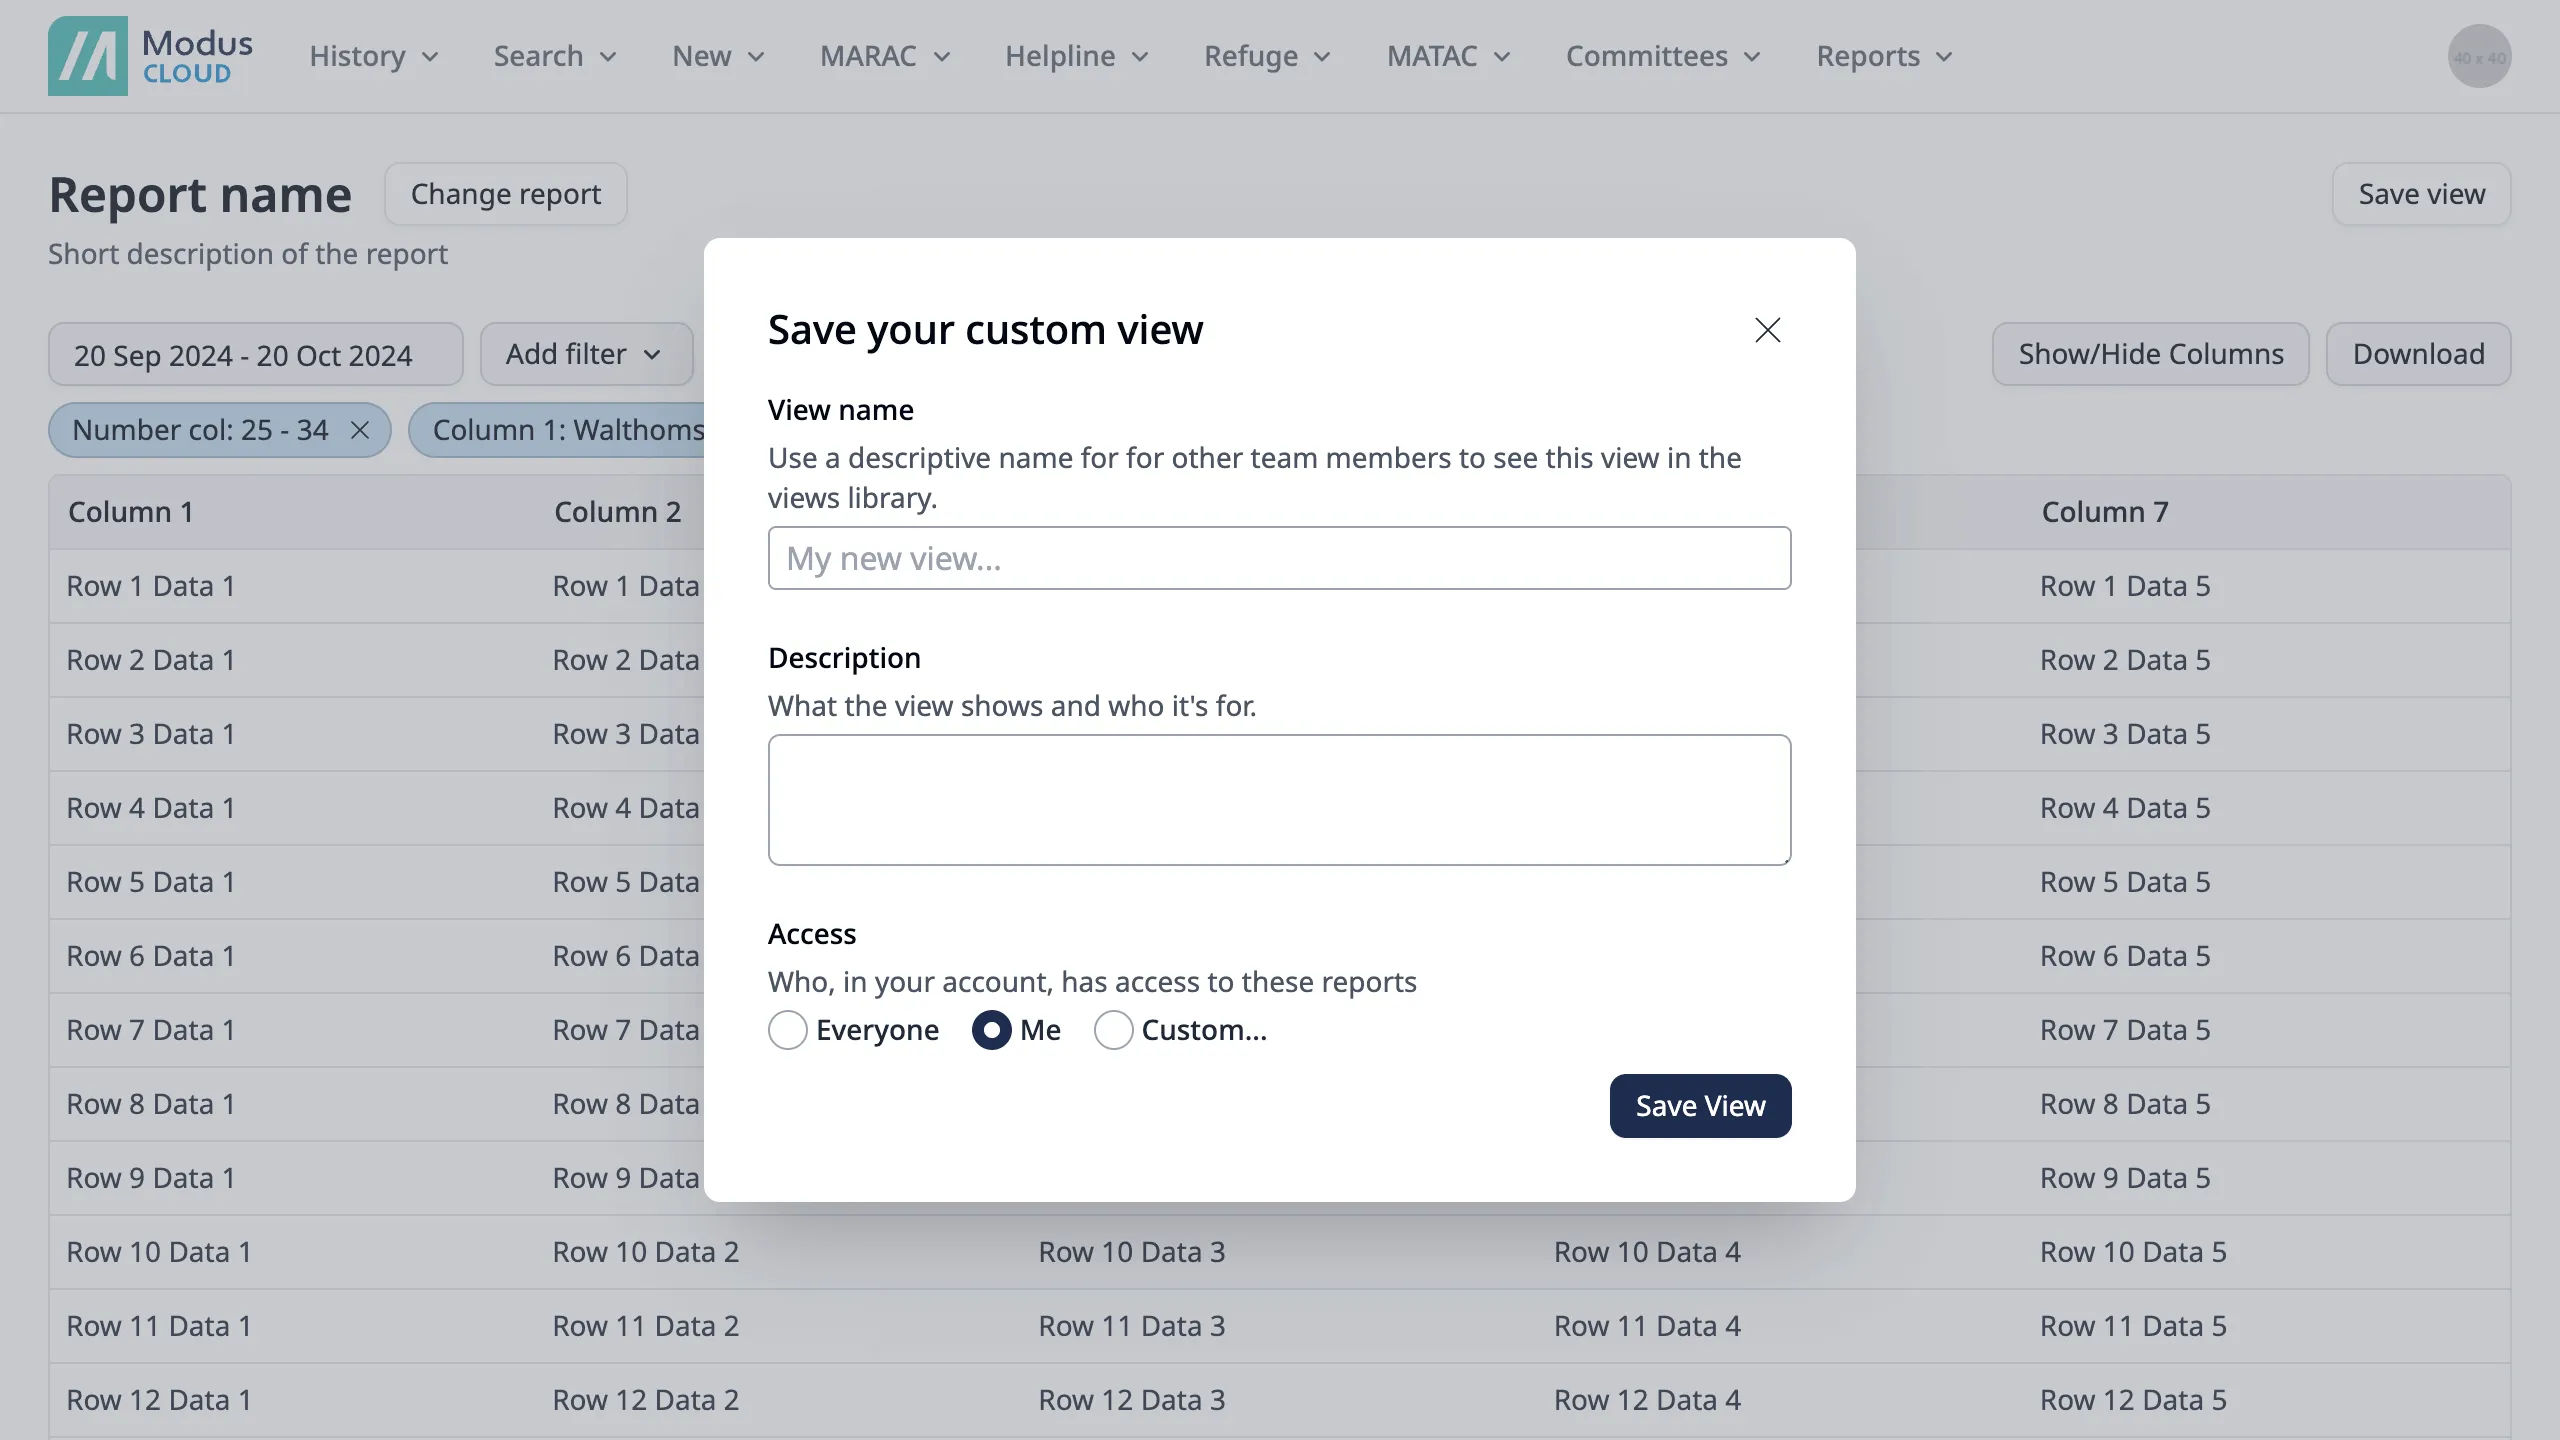
Saving a report
Users could save the current report with the applied filters, sorting and columns shown/hidden. They’ll also have the option to save it for the wider team, or just themselves. Next time they need this report, they can just use the saved report with the same filters applied.
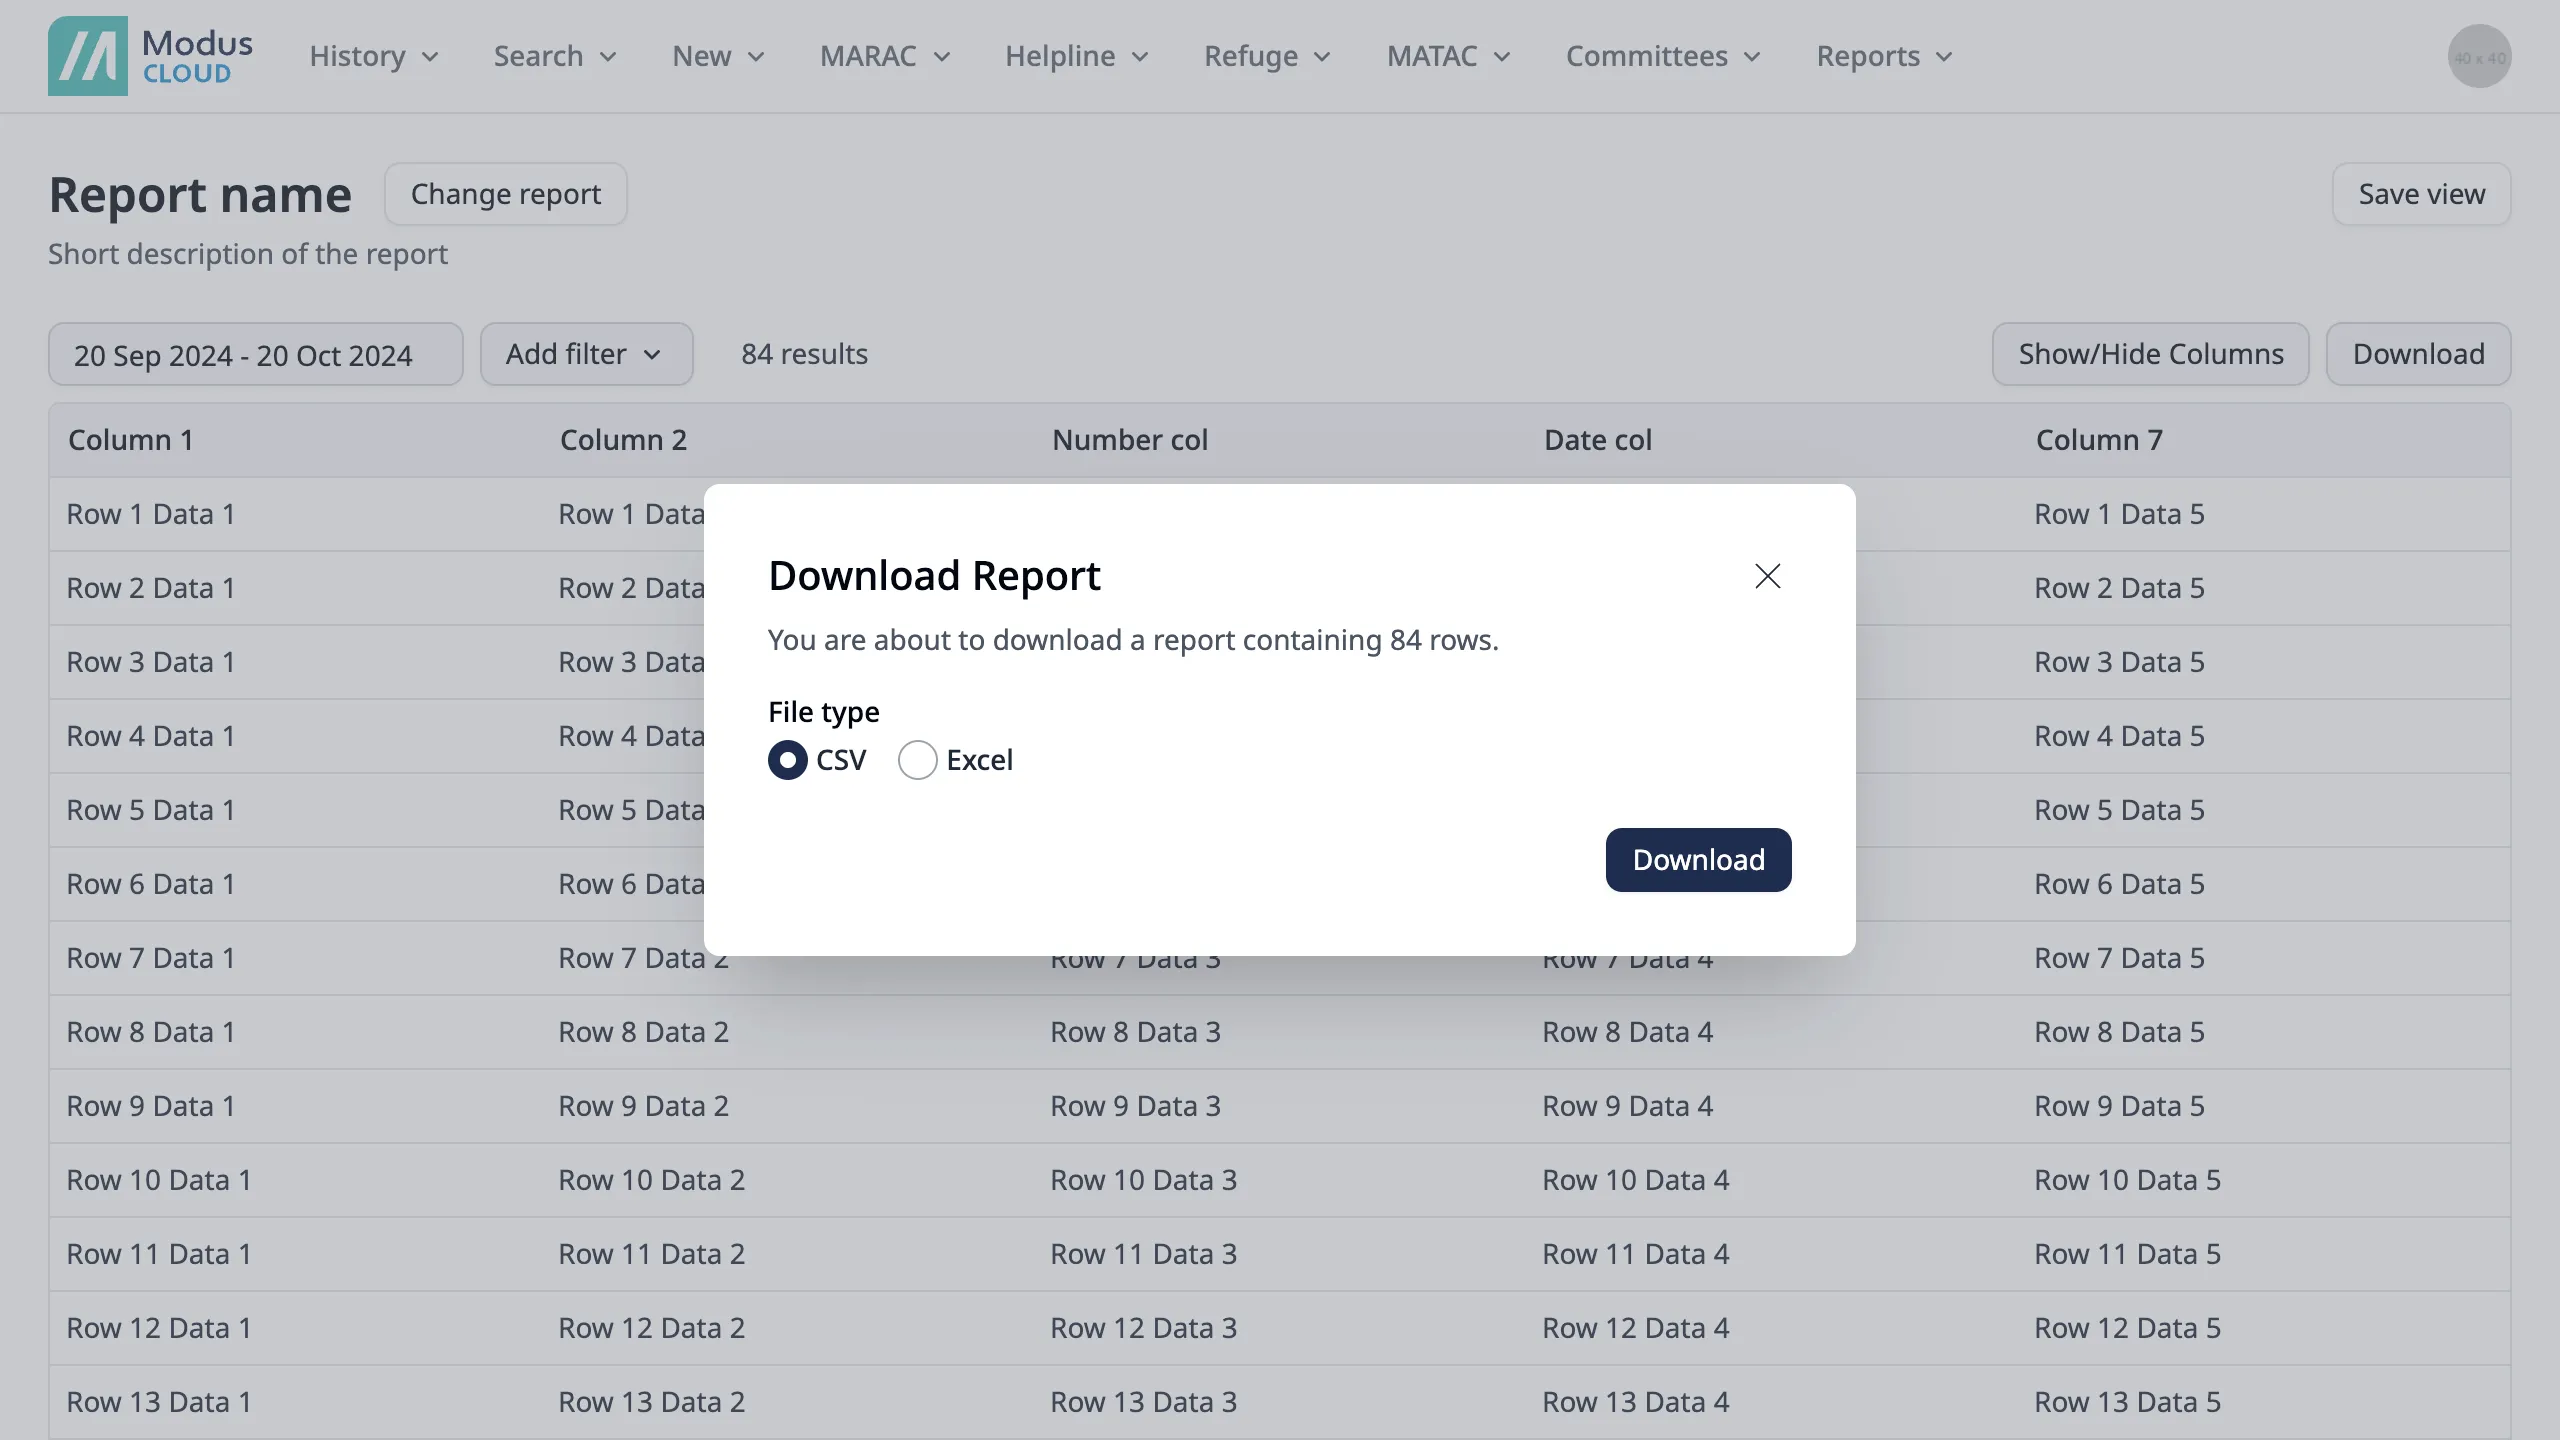
Downloading a report
Users could download the report as a CSV or PDF. Typically used for presenting reports in slide decks, or for larger organisations, data teams would merge the report data with other data sources not available in the platform.
 Jamie Lovelace